Computer Vision for Avocado Ripeness Detection
Published Jul 27, 20257 min read
- python
- machine-learning
- computer-vision
Using CNNs to combat food waste by detecting ripeness
full-length paper — code available upon request
Problem Statement
In the United States, 92 billion pounds of food go to waste each year 1. Food waste is when safe to consume food is disposed of and not eaten. The U.S. Department of Agriculture identified that food loss is another factor that causes food to go uneaten 2. Food loss includes spoilage which can occur at every stage of production and the supply chain.
Amazon Go and Amazon Fresh are already utilizing computer vision in their grocery stores to eliminate cashiers, but also use the technology to audit inventory 3. This hints at the viability to provide all retailers and consumers with a tool to track the quality and freshness of their food.
Why Avocados?
Avocado consumption in the United States has surged since 2000 4. The avocado goes through distinct color changes as it becomes ready to eat. After being picked, it is green, and over the course of a few days, the color changes to purple when it is safe to eat, and eventually black when it is overripe. These visible transformations make the avocado a suitable candidate for image-based classification.
This project proposes a computer vision model to determine the ripeness stage of avocados, with the goal of reducing waste by aiding in decisions to sell, consume, or donate to food banks.
Data Source
This project uses the ’Hass’ Avocado Ripening Photographic Dataset, featured in the paper titled: Shelf-Life Management and Ripening Assessment of ‘Hass’ Avocado (Persea americana) Using Deep Learning Approaches 5. It includes over 14,000 JPEG images (800x800 pixels) of avocados, each labeled with a ripeness stage (in an accompanying spreadsheet).
Label definitions:
- 1 — Underripe
- 2 — Breaking
- 3 — Ripe (First Stage)
- 4 — Ripe (Second Stage)
- 5 — Overripe
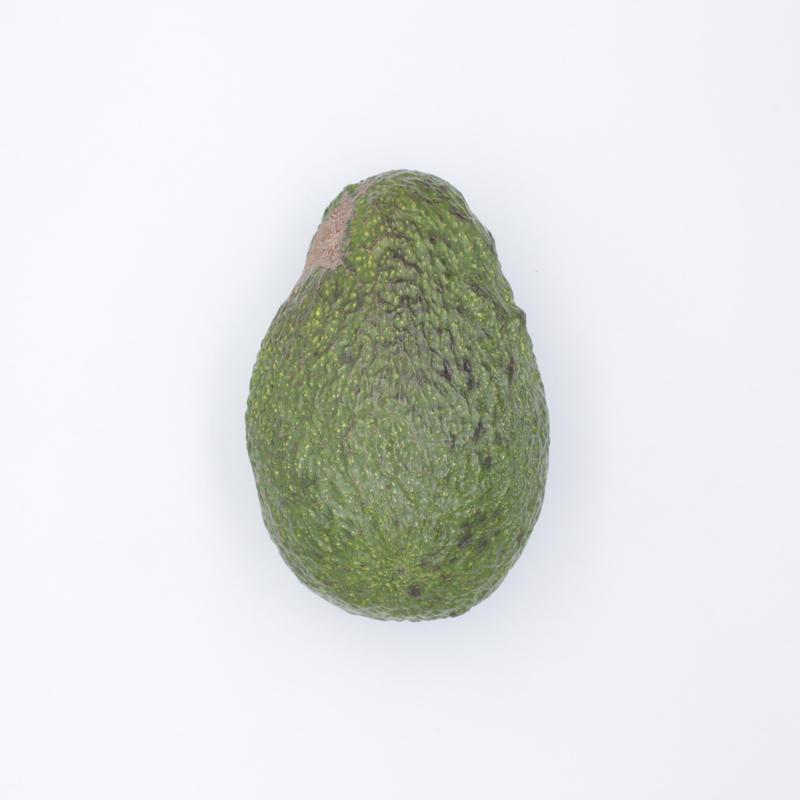
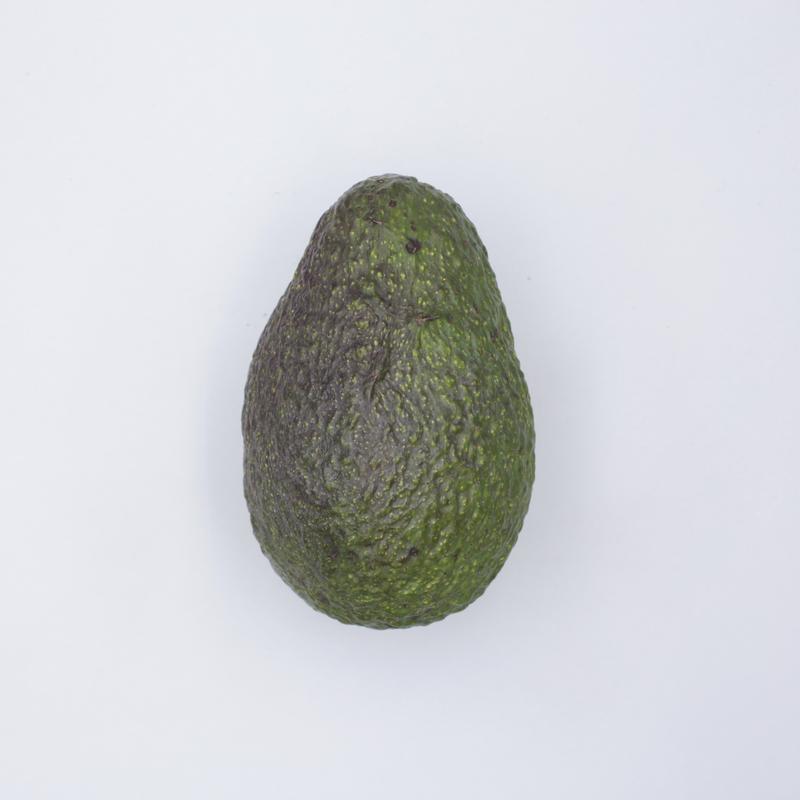
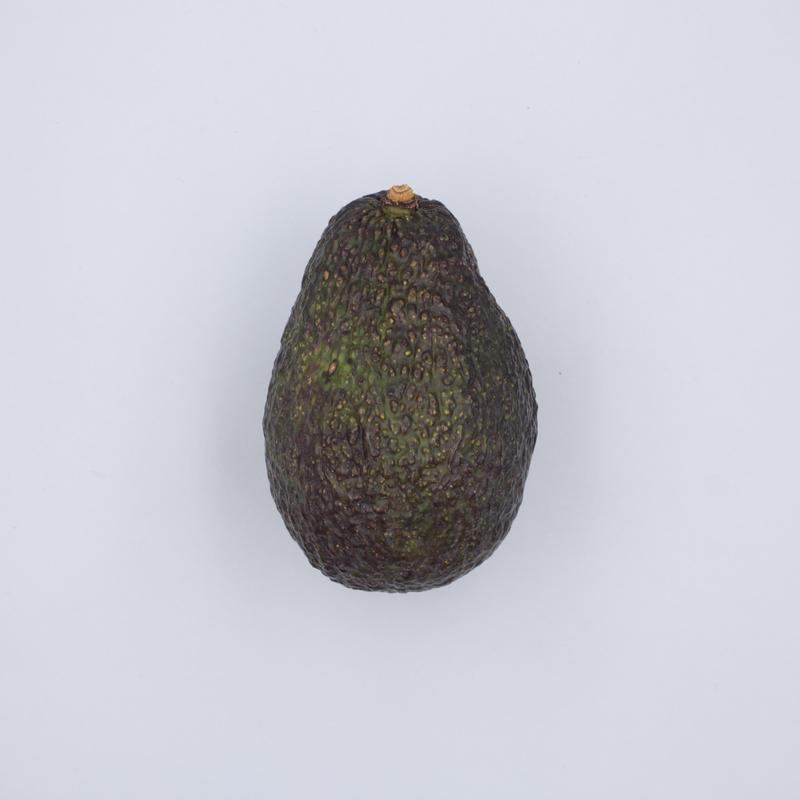
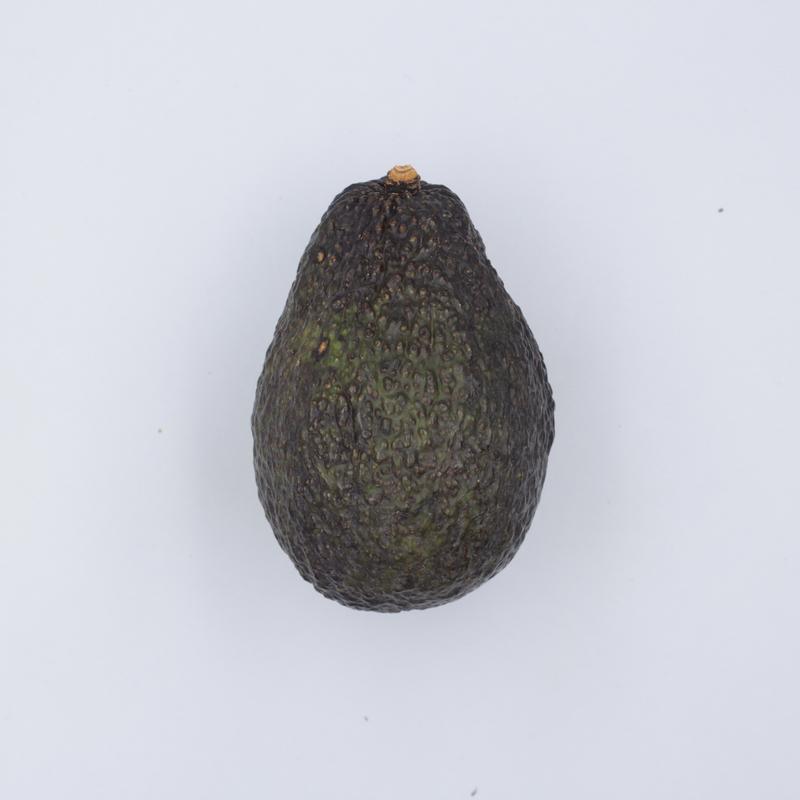
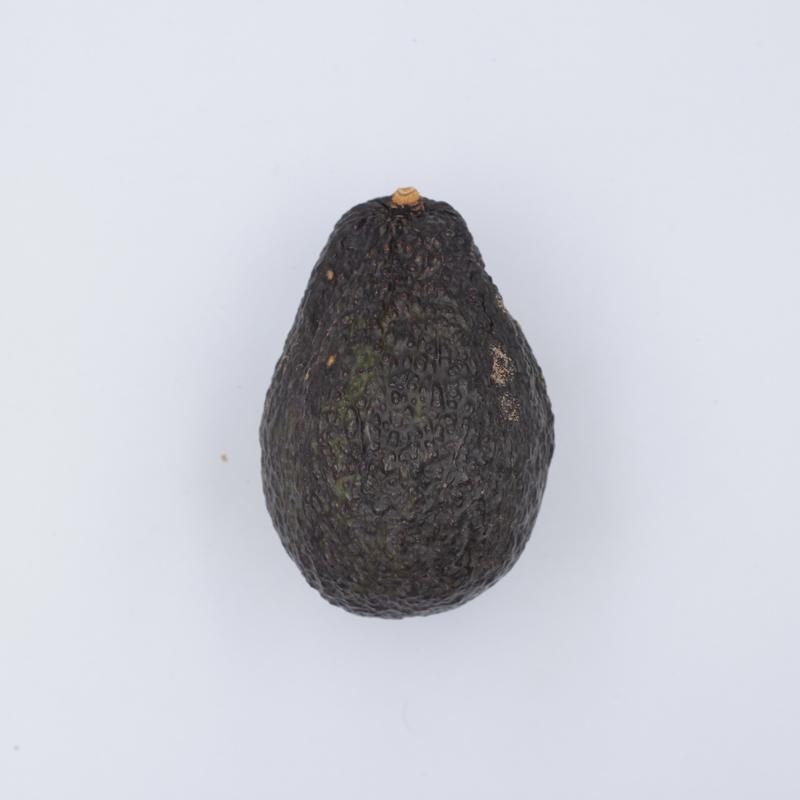
Figure 1: Examples of stage 1 (a), stage 2 (b), stage 3 (c), stage 4 (d), and stage 5 (e) samples, classified according to the 5-stage Ripening Index.
Dataset: Mendeley Data — https://data.mendeley.com/datasets/3xd9n945v8/1 6
Methodology
In order to use computer vision to classify the ripeness of avocados, I used a Convolutional Neural Network (CNN) to extract features from the images. I then split the dataset into training, validation, and test sets. I used the standard 70% training and 15% for validation and testing respectively.
In order to make my approach unique to the original paper by Xavier et al. (2024) 5, I went with a binary classification approach, ripe vs not ripe, instead of working with the 5-stage ripening index. I believe this approach is more realistic and applicable to consumers and vendors.
My CNN was trained on the dataset of avocado images but uses ResNet-18 which is a CNN pretrained on ImageNet. I used the CNN to extract features from the images, and KNN to assign labels based on those features. This approach allows the model to leverage the strengths of both CNNs for feature extraction and KNN for classification.
Choosing ResNet CNN
Convolutional Neural Networks (CNNs) are a deep learning architecture that extracts features by scanning images with filters. Each area of an image has its pixels multiplied by filters which are summed to create a feature map.
This continues and layers are formed which result in complex features being represented by weights. A popular CNN architecture is ResNet, many academic papers use ResNet-18 which is pretrained on a dataset called ImageNet. This became a great starting point for my model, I was able to extract features from images re-building the model from scratch.
KNN
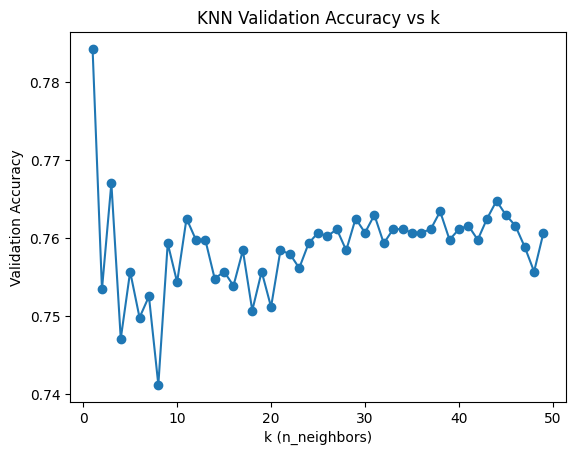
The first configuration I tested was ResNet-18 + KNN without training the CNN on the avocado dataset. An elbow plot from 0 to 50 was generated to determine the optimal value of k. k=11 was selected for all subsequent configurations as it maintains solid accuracy while smoothing out the noise and not overfitting the model too much.
KNN was then applied to the ResNet-18 feature vectors to classify the images. This alone resulted in a weighted F1 score of 76.27 and an accuracy of 76.08%. This was a good starting point, but I wanted to see if I could improve the model’s performance by training the CNN on the avocado dataset.
Further CNN configurations
After seeing the success of the initial KNN results, I then trained the CNN for 3 epochs and used KNN to classify the images. The results were strong with validation accuracy of 90.34% and once I used KNN, it increased the accuracy, resulting in a final accuracy of 91.57%. This trend continued on all subsequent configurations.
After a very strong result with 3 epochs, I wanted to see if I could improve the model’s performance by training the CNN for 20 epochs. Surprisingly, when training hte model for 20 epochs, the model’s result did not improve beyond the 3 epoch + KNN configuration. This was likely because the model was overfitting to the training data.
As you can see in the table below, I attempted multiple configurations with up to 20 epochs of training. The models varied in their performance mostly due to their class 4 and class 5 accuracy rates. After all many iterations, the next highest class 5 accuracy achieved was 82%, which was still 2% lower than my initial 3 epoch + KNN configuration.
Comparison of Model Performance (Table 1)
| ResNet CNN Configurations | Weighted‑F1 | Accuracy |
|---|---|---|
| Default + KNN | 76.27 | 76.08 |
| 3 Epochs + KNN | 91.59 | 91.57 |
| 20 Epochs + KNN | 90.60 | 90.58 |
| 20 Epochs + Targeted Augmentation + Staged LR + KNN | 90.69 | 90.67 |
| 20 Epochs + Weighted Classes + Augmentation + KNN | 90.69 | 90.67 |
Evaluation
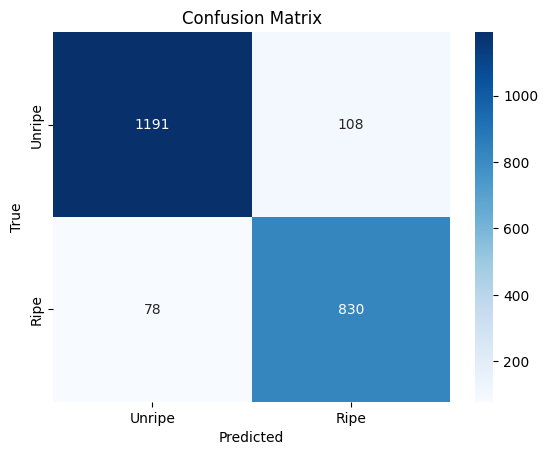
Three Epochs of training + KNN was chosen as the final model. It is simple, no augmentation, and actually yielded the best results when analyzing its performance in each class as seen in Table 2. As seen in the confusion matrix (Figure 3), the model was very accurate but occasionally misclassified unripe avocados as ripe. This is likely due to the class 5 images being visually similar to class 4 images.
Per-Class Performance Breakdown (Final Model - 3 Epochs + KNN) (Table 2)
| Class | Correct | False | Total | Accuracy (%) |
|---|---|---|---|---|
| 1 | 557 | 0 | 557 | 100.00 |
| 2 | 282 | 37 | 319 | 88.40 |
| 3 | 366 | 33 | 399 | 91.73 |
| 4 | 454 | 54 | 508 | 89.37 |
| 5 | 357 | 66 | 423 | 84.40 |
Figure 3: Confusion Matrix
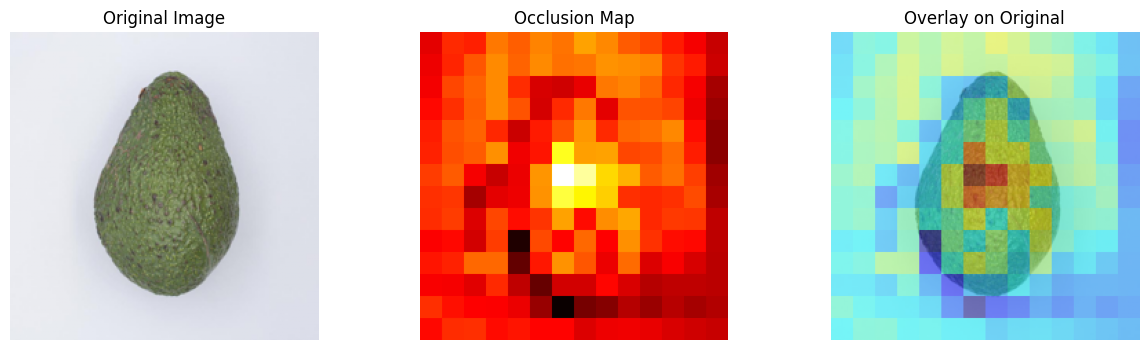
After training the model, I visualized the model’s performance using an occlusion map to visualize what the model was seeing when it classified the images. Usually occlusion maps are used to look at complex images to see if the model is looking in the right area. For models used in self-driving cars, occlusion maps may be helpful to see if the model is looking at signs, cars, pedestrians, etc. In this case I used it to confirm the model is not picking up on noise such as shadows in the background or any other artifacts in the images.
Figure 4: Occlusion Map
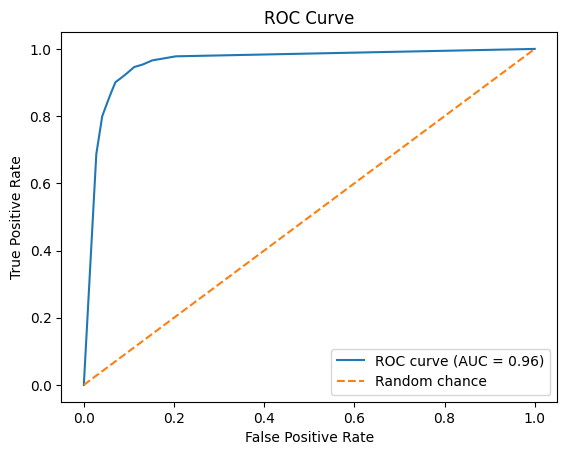
I also evaluated the Receiver Operating Characteristic (ROC) curve. Given the model’s AUC of .96, it is clear that the model is distinguishing between the classes at a rate much higher than random chance.
Figure 5: ROC Curve
Future Work and Potential Improvements
- Improve class 5 performance (overripe) via alternative CNN architectures (e.g., AlexNet, VGG) and testing more complex augmentation approaches.
- Test on camera feeds to mimic real-world performance or use more cluttered datasets to assess the model’s resiliance to distractions, lighting, angles, etc.
Conclusion
Across multiple CNN configurations and analyses, results indicate strong potential for ripeness classification in real applications. While external validation on new datasets is necessary for future testing, the current model should correctly classify most avocados when the fruit is visible and unobstructed. Given ongoing computer‑vision adoption in retail operations, models like this can help reduce food waste and support better consumer decisions.
Footnotes
-
Feeding America (2025). Our Work: Reduce Food Waste. https://www.feedingamerica.org/our-work/reduce-food-waste ↩
-
United States Department of Agriculture (2025). Food Waste FAQs. https://www.usda.gov/about-food/food-safety/food-loss-and-waste/food-waste-faqs ↩
-
Amazon UK (2018). Machine learning: Using algorithms to sort fruit. https://www.aboutamazon.co.uk/news/innovation/machine-learning-using-algorithms-to-sort-fruit ↩
-
Statista (2025). Average avocado consumption in the United States per week. https://www.statista.com/statistics/591263/average-avocado-consumption-us-per-week/ ↩
-
Xavier, P., Rodrigues, P. M., & Silva, C. L. M. (2024). Shelf‑Life Management and Ripening Assessment of ‘Hass’ Avocado (Persea americana) Using Deep Learning Approaches. Foods, 13(8), 1150. https://doi.org/10.3390/foods13081150 ↩ ↩2
-
Hass Avocado Ripening Photographic Dataset (Mendeley Data). https://data.mendeley.com/datasets/3xd9n945v8/1 ↩